All-in-One Solution for observability in Go Microservices using Prometheus, Loki, Promtail, Grafana and Tempo

In this post, I will try to demonstrate how to build a complete observability solution for a go microservice with Prometheus, Loki, Promtail, Tempo and interacting with the Grafana dashboard. In API layer, I will use Fiber framework for building a simple service. If you are in a hurry, you can find the source code in this section.
Prerequisites:
- Go 1.22
- Docker (and docker-compose)
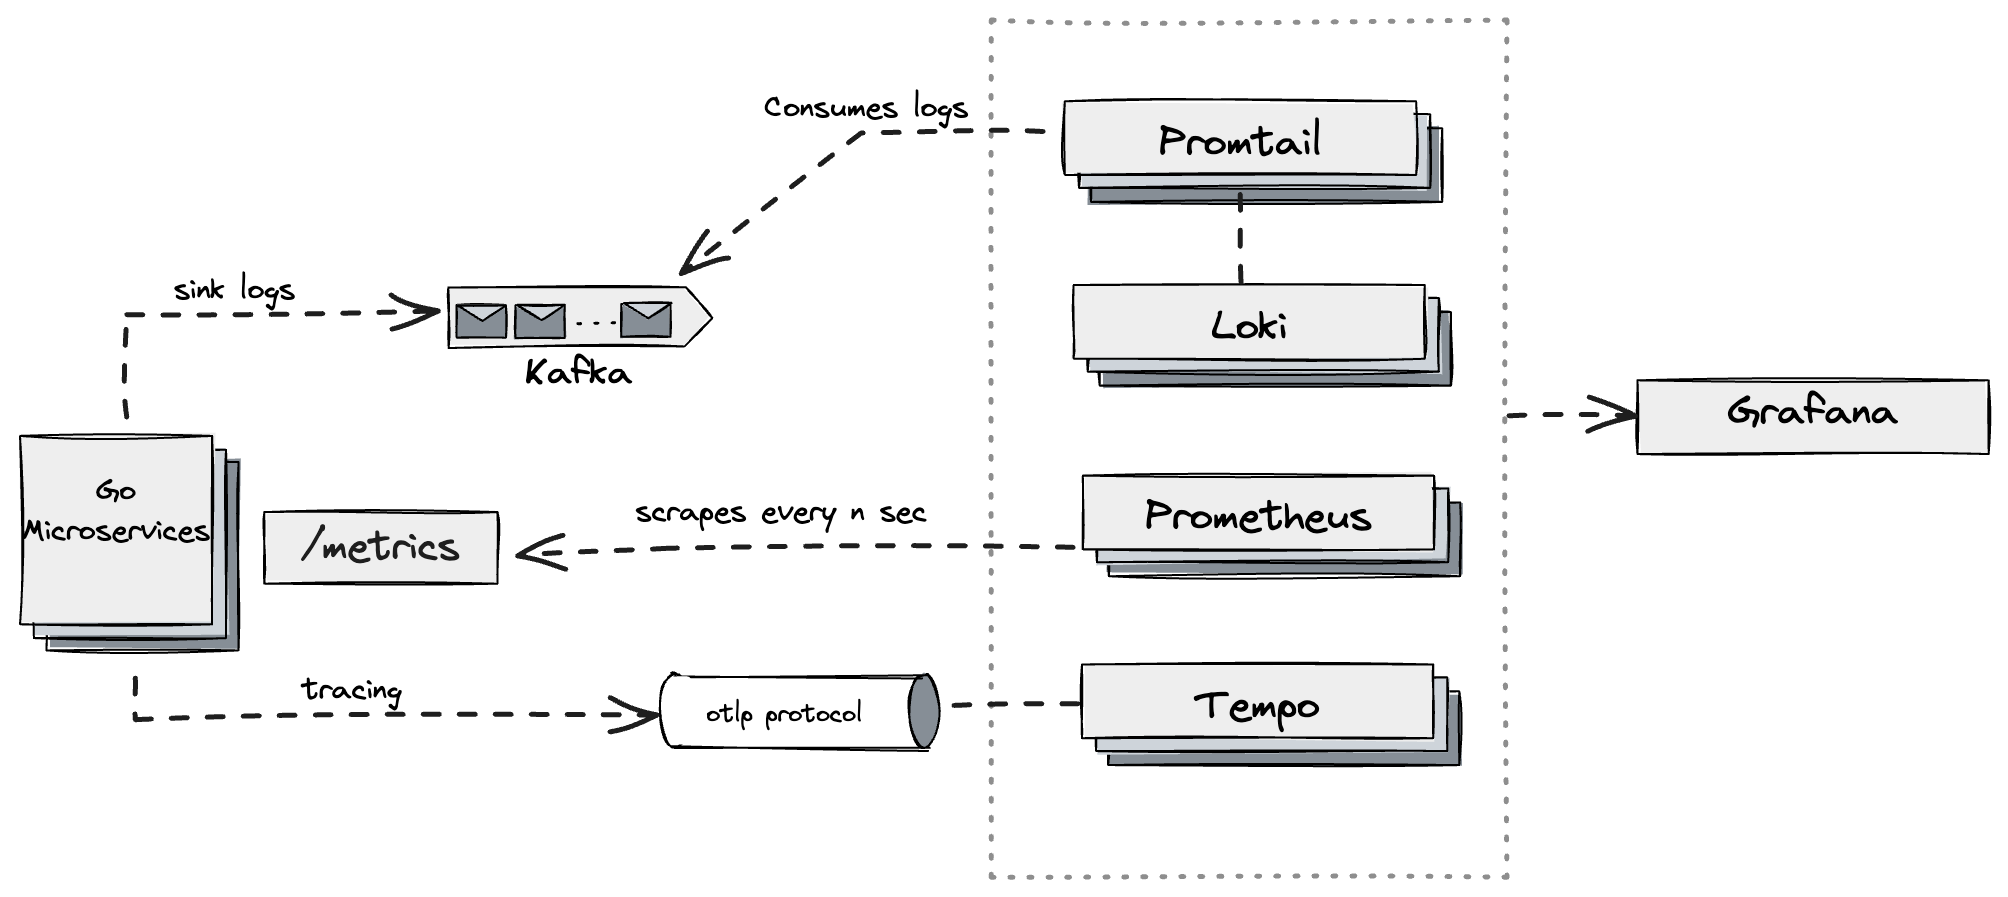
While gathering logs, I also create a kafka sink to consuming logs on promtail for loki. Promtail has flexibility to gather logs from files or different data sources as well.
Architecture
Prometheus Integration
We create a factory for Prometheus integration so that, this factory can handle the registring the prometheus registry and also http handler for prometheus metrics which can be used in the application.
 1type PrometheusFactory interface {
 2	InitHandler() http.Handler
 3}
 4
 5type prometheusFactory struct {
 6	registry *prometheus.Registry
 7}
 8
 9func NewPrometheusFactory(cs ...prometheus.Collector) PrometheusFactory {
10	f := &prometheusFactory{}
11	f.registry = f.initRegistry(cs)
12	return f
13}
14
15func (f *prometheusFactory) InitHandler() http.Handler {
16	return promhttp.HandlerFor(f.registry, promhttp.HandlerOpts{Registry: f.registry})
17}
18
19func (f *prometheusFactory) initRegistry(cs []prometheus.Collector) *prometheus.Registry {
20	reg := prometheus.NewRegistry()
21	defaultCs := []prometheus.Collector{
22		collectors.NewGoCollector(),
23		collectors.NewProcessCollector(collectors.ProcessCollectorOpts{}),
24	}
25
26	fCS := make([]prometheus.Collector, 0, len(defaultCs)+len(cs))
27	fCS = append(fCS, defaultCs...)
28
29	for _, c := range cs {
30		if c != nil {
31			fCS = append(fCS, c)
32		}
33	}
34
35	reg.MustRegister(fCS...)
36
37	return reg
38}
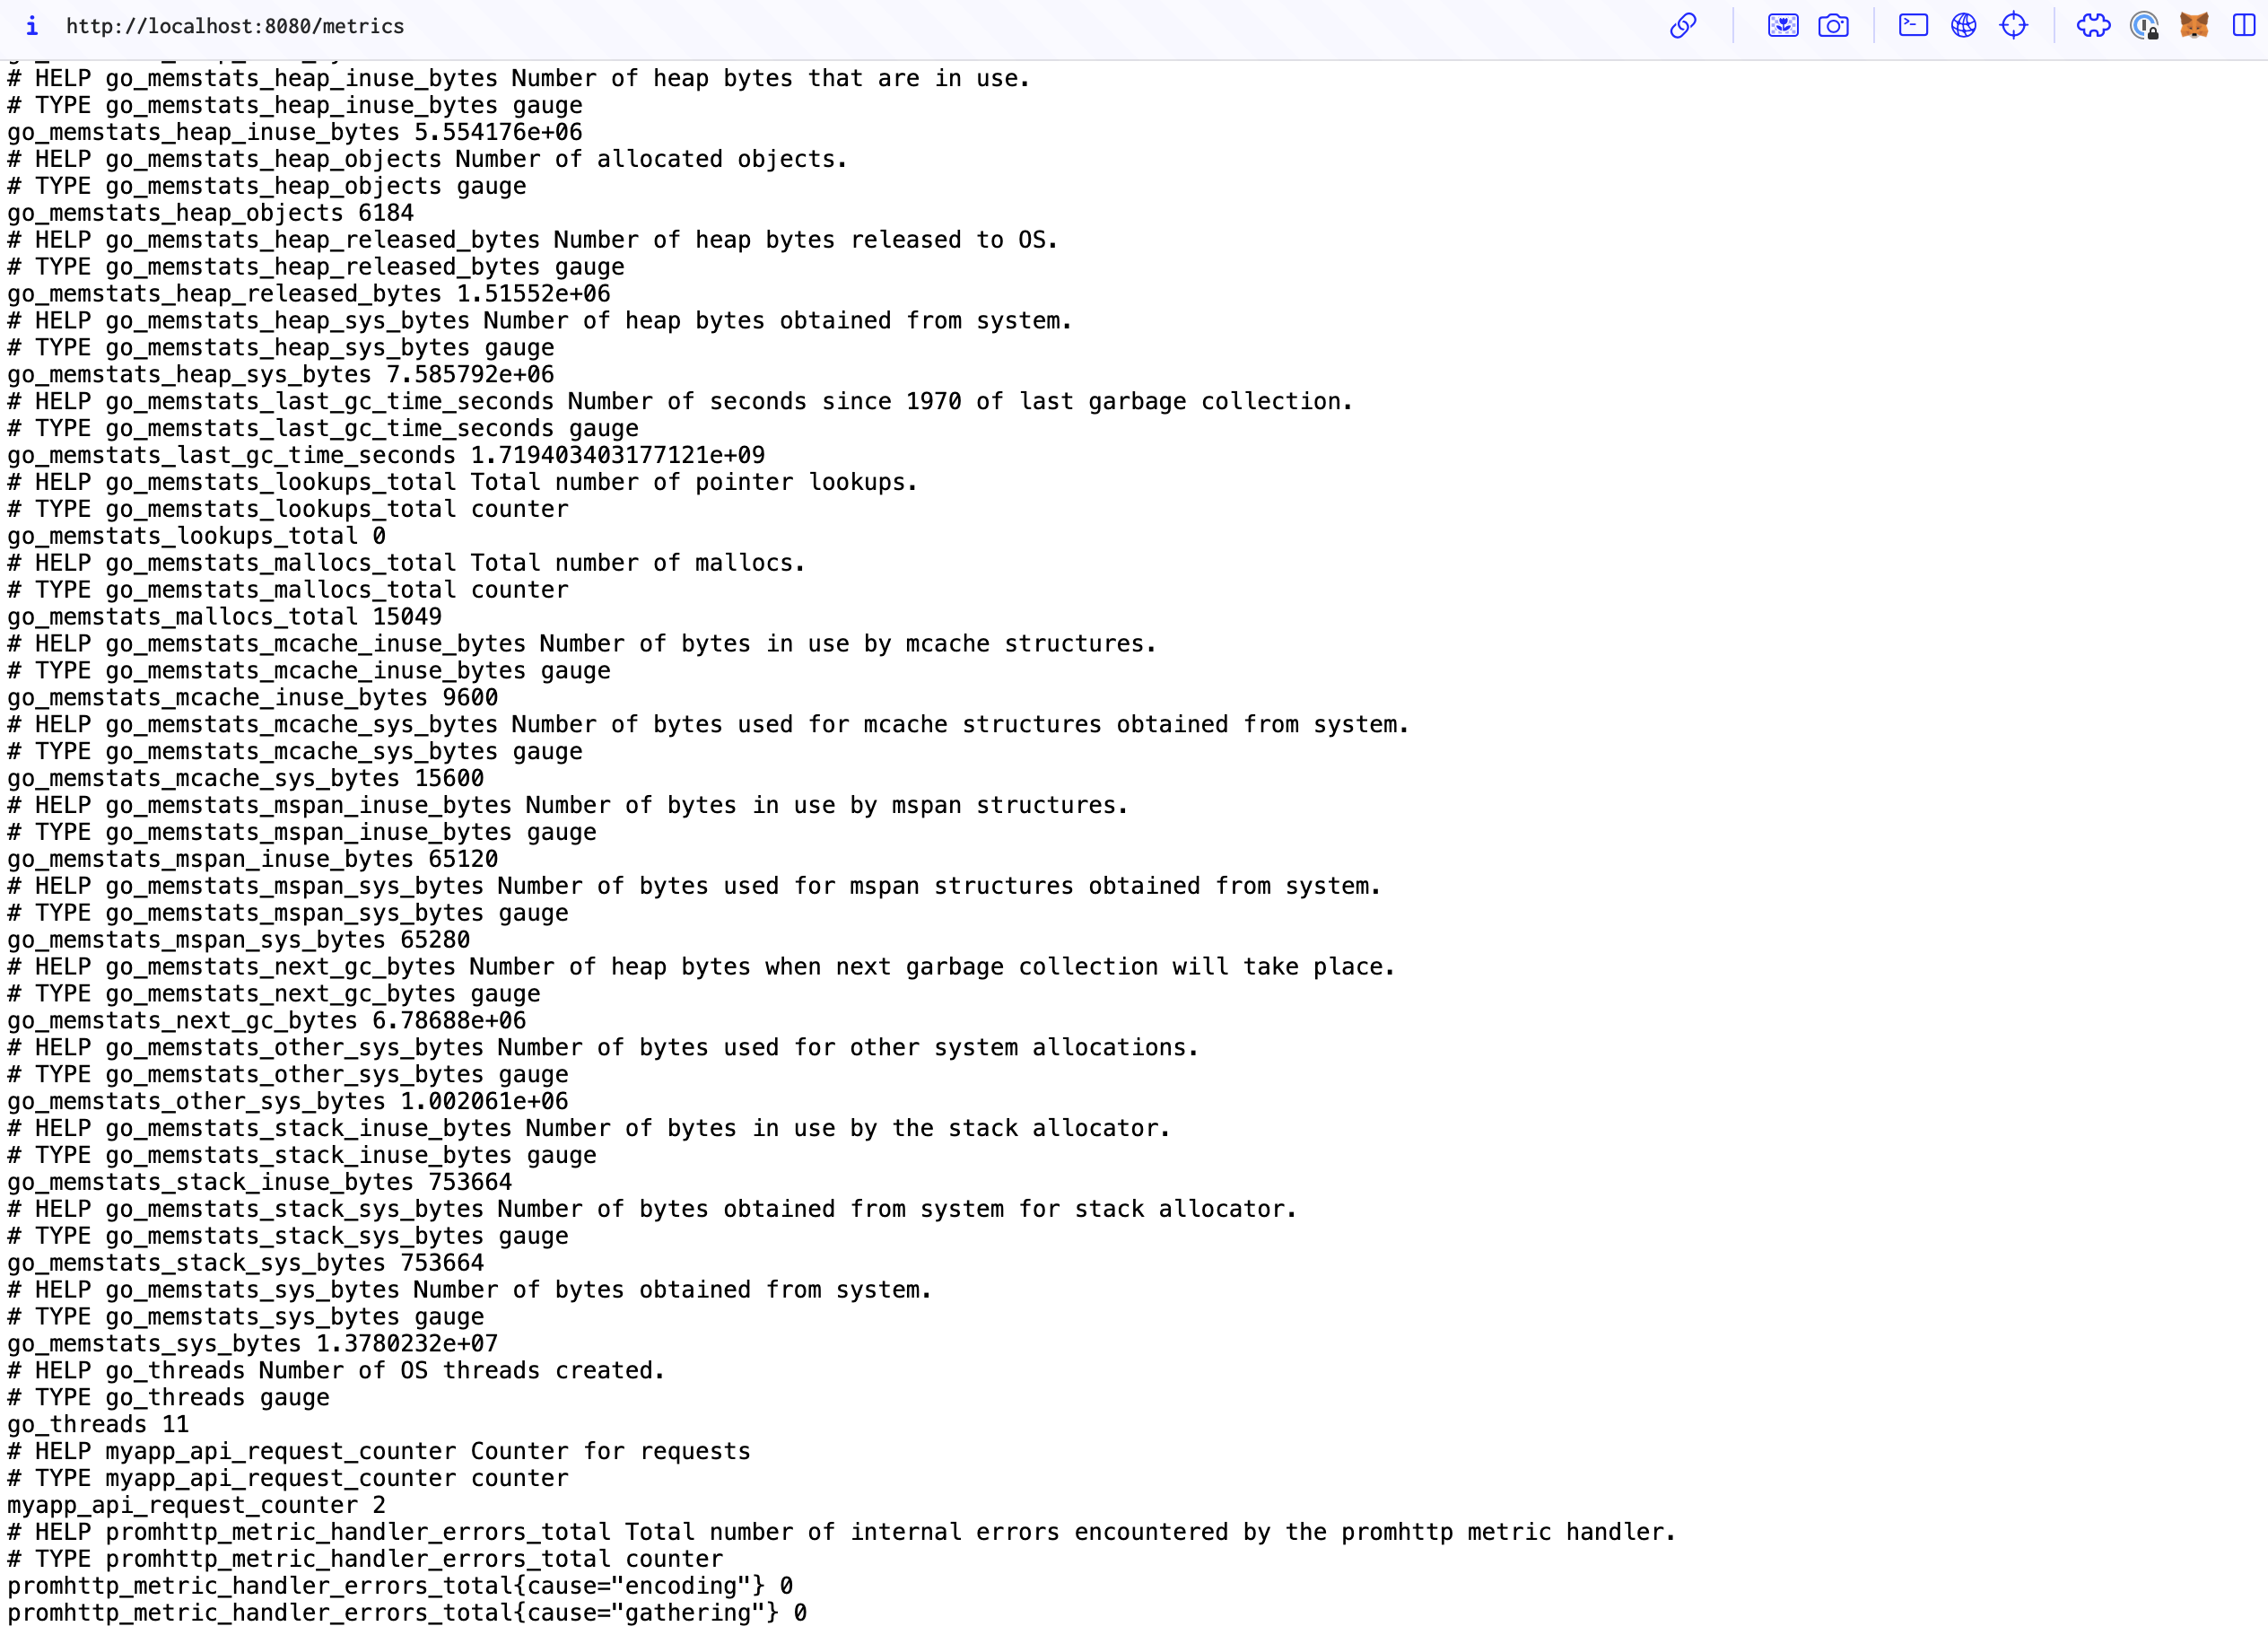
When we started the application with the following factory instance and tying the handler to the /metrics endpoint, we can see the metrics on the response.
Following code blocks, shows us how to bind the handler to the go-fiber router. Actually, it is basically net/http handler.
1app.Get("/metrics", adaptor.HTTPHandler(a.PrometheusFactory.InitHandler()))
During this definition, just to be make sure it shouldn’t be under any business logic related middleware or that can affect the metrics. By applying this approach, we can play with any metrics on any middleware or handler.
Sending Custom Metrics to Prometheus
We can define any custom metrics metrics and register them to the prometheus registry. For instance, on following code block we defined a counter metric for counting the requests.
 1package metric
 2
 3import "github.com/prometheus/client_golang/prometheus"
 4
 5var TestCounter = prometheus.NewCounter(prometheus.CounterOpts{
 6	Namespace:   "myapp",
 7	Subsystem:   "api",
 8	Name:        "request_counter",
 9	Help:        "Counter for requests",
10	ConstLabels: nil,
11})
Registering the custom metrics to the prometheus registry is also simple as following:
1promFactory := factory.NewPrometheusFactory(
2		metric.TestCounter,
3)
Also we can create a request counter to observe that custom metric inside the application.
 1package middleware
 2
 3import (
 4	"github.com/gofiber/fiber/v2"
 5	"github.com/ilkerkorkut/go-examples/microservice/observability/internal/metric"
 6)
 7
 8func MetricsMiddleware() func(c *fiber.Ctx) error {
 9	return func(c *fiber.Ctx) (err error) {
10		metric.TestCounter.Add(1)
11		return c.Next()
12	}
13}
Setting up Logging with Zap to Sink into Kafka
Zap logging library is commonly used in go applications. It is fast and flexible. So, we will use it in our application. We can define a logger factory to create a logger instance with some configurations.
First we can create a kafka sink for the logger. We will use IBM/sarama kafka client for that purpose.
 1package logging
 2
 3import (
 4	"time"
 5
 6	"github.com/IBM/sarama"
 7)
 8
 9type kafkaSink struct {
10	producer sarama.SyncProducer
11	topic    string
12}
13
14func (s kafkaSink) Write(b []byte) (int, error) {
15	_, _, err := s.producer.SendMessage(&sarama.ProducerMessage{
16		Topic: s.topic,
17		Key:   sarama.StringEncoder(time.Now().String()),
18		Value: sarama.ByteEncoder(b),
19	})
20	return len(b), err
21}
22
23func (s kafkaSink) Sync() error {
24	return nil
25}
26
27func (s kafkaSink) Close() error {
28	return nil
29}
You can ask why there is Sync and Close methods.
When we take a look tha zap’s Sink interface, it derives from WriteSyncer and io.Closer interfaces. Because of that we need to implement all of the methods, this is golang interface’s nature.
1type Sink interface {
2	zapcore.WriteSyncer
3	io.Closer
4}
Then, we can create a simple application logger initializer as follows;
 1package logging
 2
 3import (
 4	"fmt"
 5	"log"
 6	"net/url"
 7	"strings"
 8
 9	"github.com/IBM/sarama"
10	"go.uber.org/zap"
11	"go.uber.org/zap/zapcore"
12)
13
14func InitLogger(lvl string, kafkaBrokers []string) (*zap.Logger, error) {
15	level, err := parseLevel(lvl)
16	if err != nil {
17		return nil, err
18	}
19
20	return getLogger(level, kafkaBrokers), nil
21}
22
23func getLogger(
24	level zapcore.Level,
25	kafkaBrokers []string,
26) *zap.Logger {
27	kafkaURL := url.URL{Scheme: "kafka", Host: strings.Join(kafkaBrokers, ",")}
28
29	ec := zap.NewProductionEncoderConfig()
30	ec.EncodeName = zapcore.FullNameEncoder
31	ec.EncodeName = zapcore.FullNameEncoder
32	ec.EncodeTime = zapcore.RFC3339TimeEncoder
33	ec.EncodeDuration = zapcore.MillisDurationEncoder
34	ec.EncodeLevel = zapcore.CapitalLevelEncoder
35	ec.EncodeCaller = zapcore.ShortCallerEncoder
36	ec.NameKey = "logger"
37	ec.MessageKey = "message"
38	ec.LevelKey = "level"
39	ec.TimeKey = "timestamp"
40	ec.CallerKey = "caller"
41	ec.StacktraceKey = "trace"
42	ec.LineEnding = zapcore.DefaultLineEnding
43	ec.ConsoleSeparator = " "
44
45	zapConfig := zap.Config{}
46	zapConfig.Level = zap.NewAtomicLevelAt(level)
47	zapConfig.Encoding = "json"
48	zapConfig.EncoderConfig = ec
49	zapConfig.OutputPaths = []string{"stdout", kafkaURL.String()}
50	zapConfig.ErrorOutputPaths = []string{"stderr", kafkaURL.String()}
51
52	if kafkaBrokers != nil || len(kafkaBrokers) > 0 {
53		err := zap.RegisterSink("kafka", func(_ *url.URL) (zap.Sink, error) {
54			config := sarama.NewConfig()
55			config.Producer.Return.Successes = true
56
57			producer, err := sarama.NewSyncProducer(kafkaBrokers, config)
58			if err != nil {
59				log.Fatal("failed to create kafka producer", err)
60				return kafkaSink{}, err
61			}
62
63			return kafkaSink{
64				producer: producer,
65				topic:    "application.logs",
66			}, nil
67		})
68		if err != nil {
69			log.Fatal("failed to register kafka sink", err)
70		}
71	}
72
73	zapLogger, err := zapConfig.Build(
74		zap.AddCaller(),
75		zap.AddStacktrace(zapcore.ErrorLevel),
76	)
77	if err != nil {
78		log.Fatal("failed to build zap logger", err)
79	}
80
81	return zapLogger
82}
83
84func parseLevel(lvl string) (zapcore.Level, error) {
85	switch strings.ToLower(lvl) {
86	case "debug":
87		return zap.DebugLevel, nil
88	case "info":
89		return zap.InfoLevel, nil
90	case "warn":
91		return zap.WarnLevel, nil
92	case "error":
93		return zap.ErrorLevel, nil
94	}
95	return zap.InfoLevel, fmt.Errorf("invalid log level <%v>", lvl)
96}
We are covering the initial logger level, and registering kafka sink and default encoding congiruations. Just, keep in mind, there are some hard-coded parts like application.logs topic we will use it on kafka. You can define environment variables or applications configs for these kind of hard-coded values.
Distributed Tracing with Tempo via OpenTelemetry
Tempo is open-source grafana’s distributed tracing backend. It’s quite simple and it can provide the tracing options like jaeger, zipkin, opentelemtry protocol etc. In this project, we will use the opentelemetry protocol to send the traces to tempo endpoint.
While defining the tracing we will use otelfiber library to integrate the opentelemetry with fiber framework. It propagates the tracing context over the fiber’s UserContext.
But at first we have to define our tracingprovider and exporter.
 1exp, err := factory.NewOTLPExporter(ctx, cm.GetOTLPConfig().OTLPEndpoint)
 2if err != nil {
 3  log.Printf("failed to create OTLP exporter: %v", err)
 4  return
 5}
 6
 7tp := factory.NewTraceProvider(exp, cm.GetAppConfig().Name)
 8defer func() { _ = tp.Shutdown(ctx) }()
 9
10otel.SetTracerProvider(tp)
11otel.SetTextMapPropagator(propagation.NewCompositeTextMapPropagator(propagation.TraceContext{}, propagation.Baggage{}))
Above codeblock defines the opentelemetry tracerprovider and exporter.
Then, we can define the fiber middleware for tracing as follows;
1app.Use(
2  otelfiber.Middleware(
3  otelfiber.WithTracerProvider(
4    a.TracerProvider,
5  ),
6  otelfiber.WithNext(func(c *fiber.Ctx) bool {
7    return c.Path() == "/metrics"
8  }),
9))
As you see, we can skip the tracing for the /metrics endpoint. Because, it is not a business logic in our application.
Setting up Simple Go Microservice with Fiber
We set a router handler with a simple http request to SWAPI. We will use this handler to demonstrate the observability features.
 1func (s *dataService) GetData(
 2	ctx context.Context,
 3	id string,
 4) (map[string]any, error) {
 5	span := trace.SpanFromContext(ctx)
 6
 7	span.AddEvent("Starting fake long running task")
 8
 9	sleepTime := 70
10	sleepTimeDuration := time.Duration(sleepTime * int(time.Millisecond))
11	time.Sleep(sleepTimeDuration)
12
13	span.AddEvent("Done first fake long running task")
14
15	span.AddEvent("Starting request to Star Wars API")
16
17	s.logger.
18		With(zap.String("traceID", span.SpanContext().TraceID().String())).
19		Info("Getting data", zap.String("id", id))
20	res, err := s.client.StarWars().GetPerson(ctx, id)
21	if err != nil {
22		span.RecordError(err)
23		return nil, err
24	}
25
26	span.AddEvent("Done request to Star Wars API")
27
28	return res, nil
29}
In this code block, we defined the span events and added http request context to resty client to trace external requests as well. With this approach, it is able to trace databases or any external services requests from our microservice.
Also, during logging we can add trace id via getting it from span context;
1span.SpanContext().TraceID().String()
It will give ability while examining the logs also we can query the traces with the same trace id.
Exploring via Grafana Dashboard
Firstly, you can see the metrics on both Grafana and Prometheus metrics endpoint;
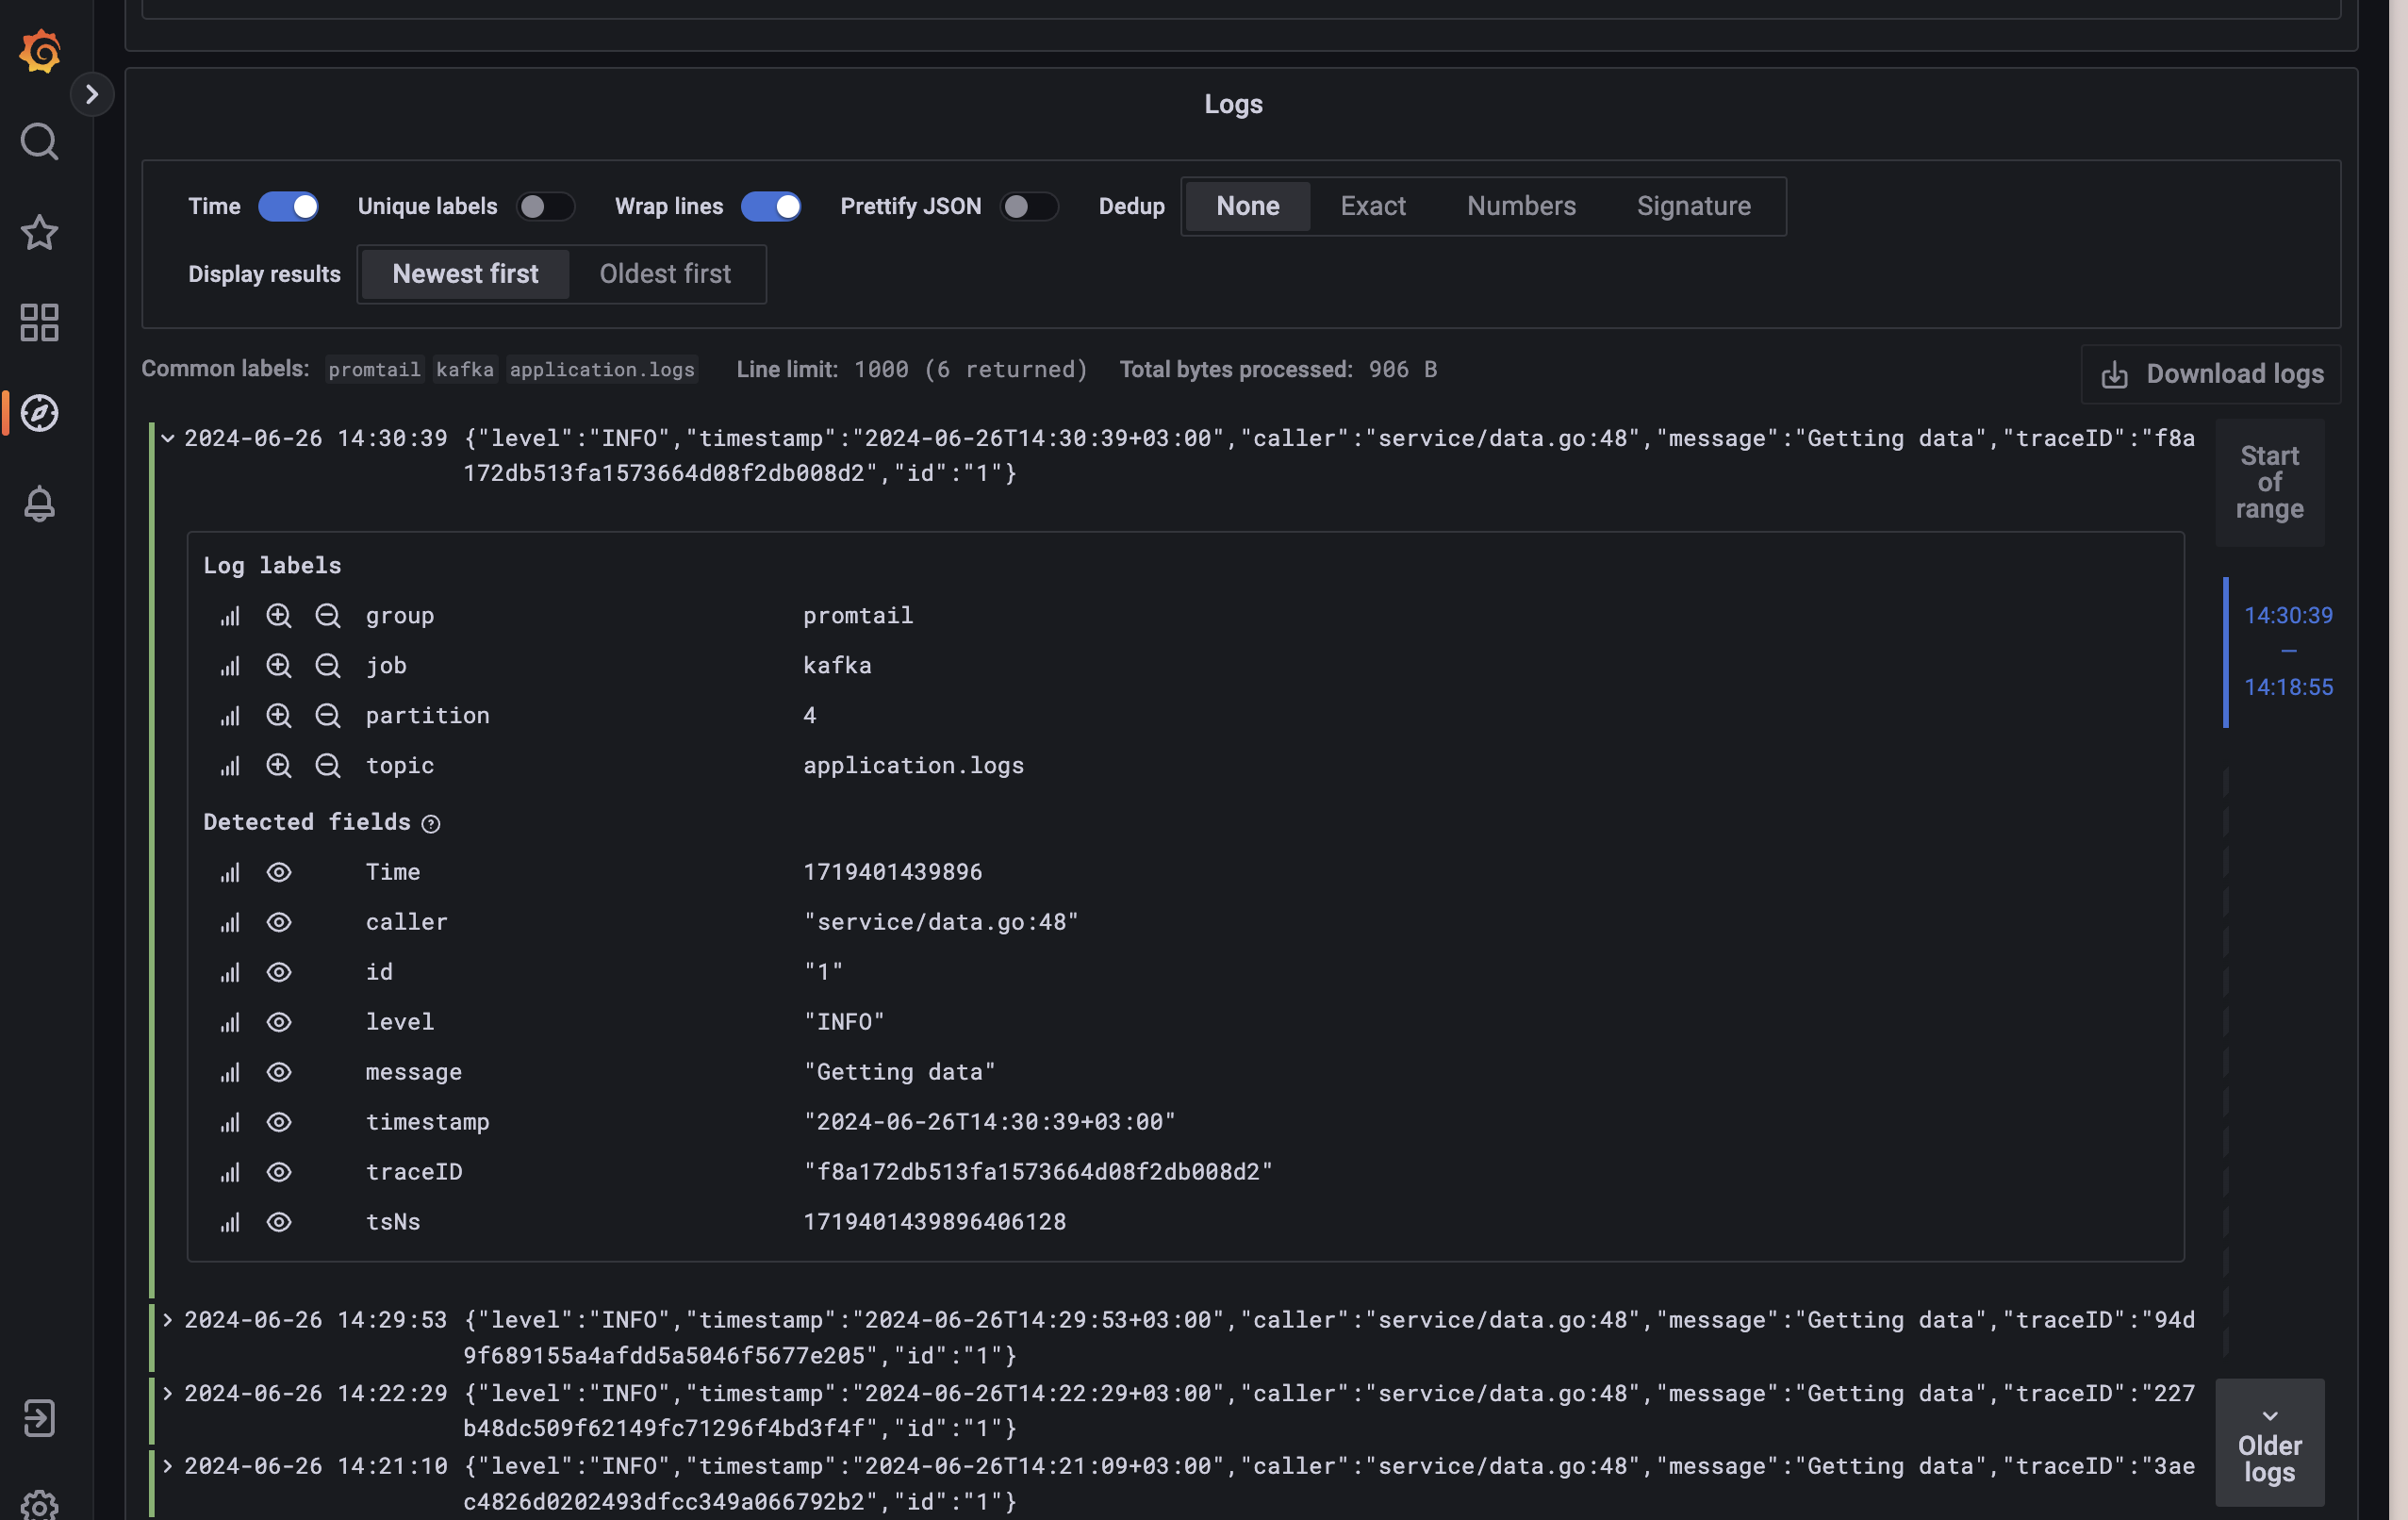
Exploring the logs on Grafana via Loki datasource;
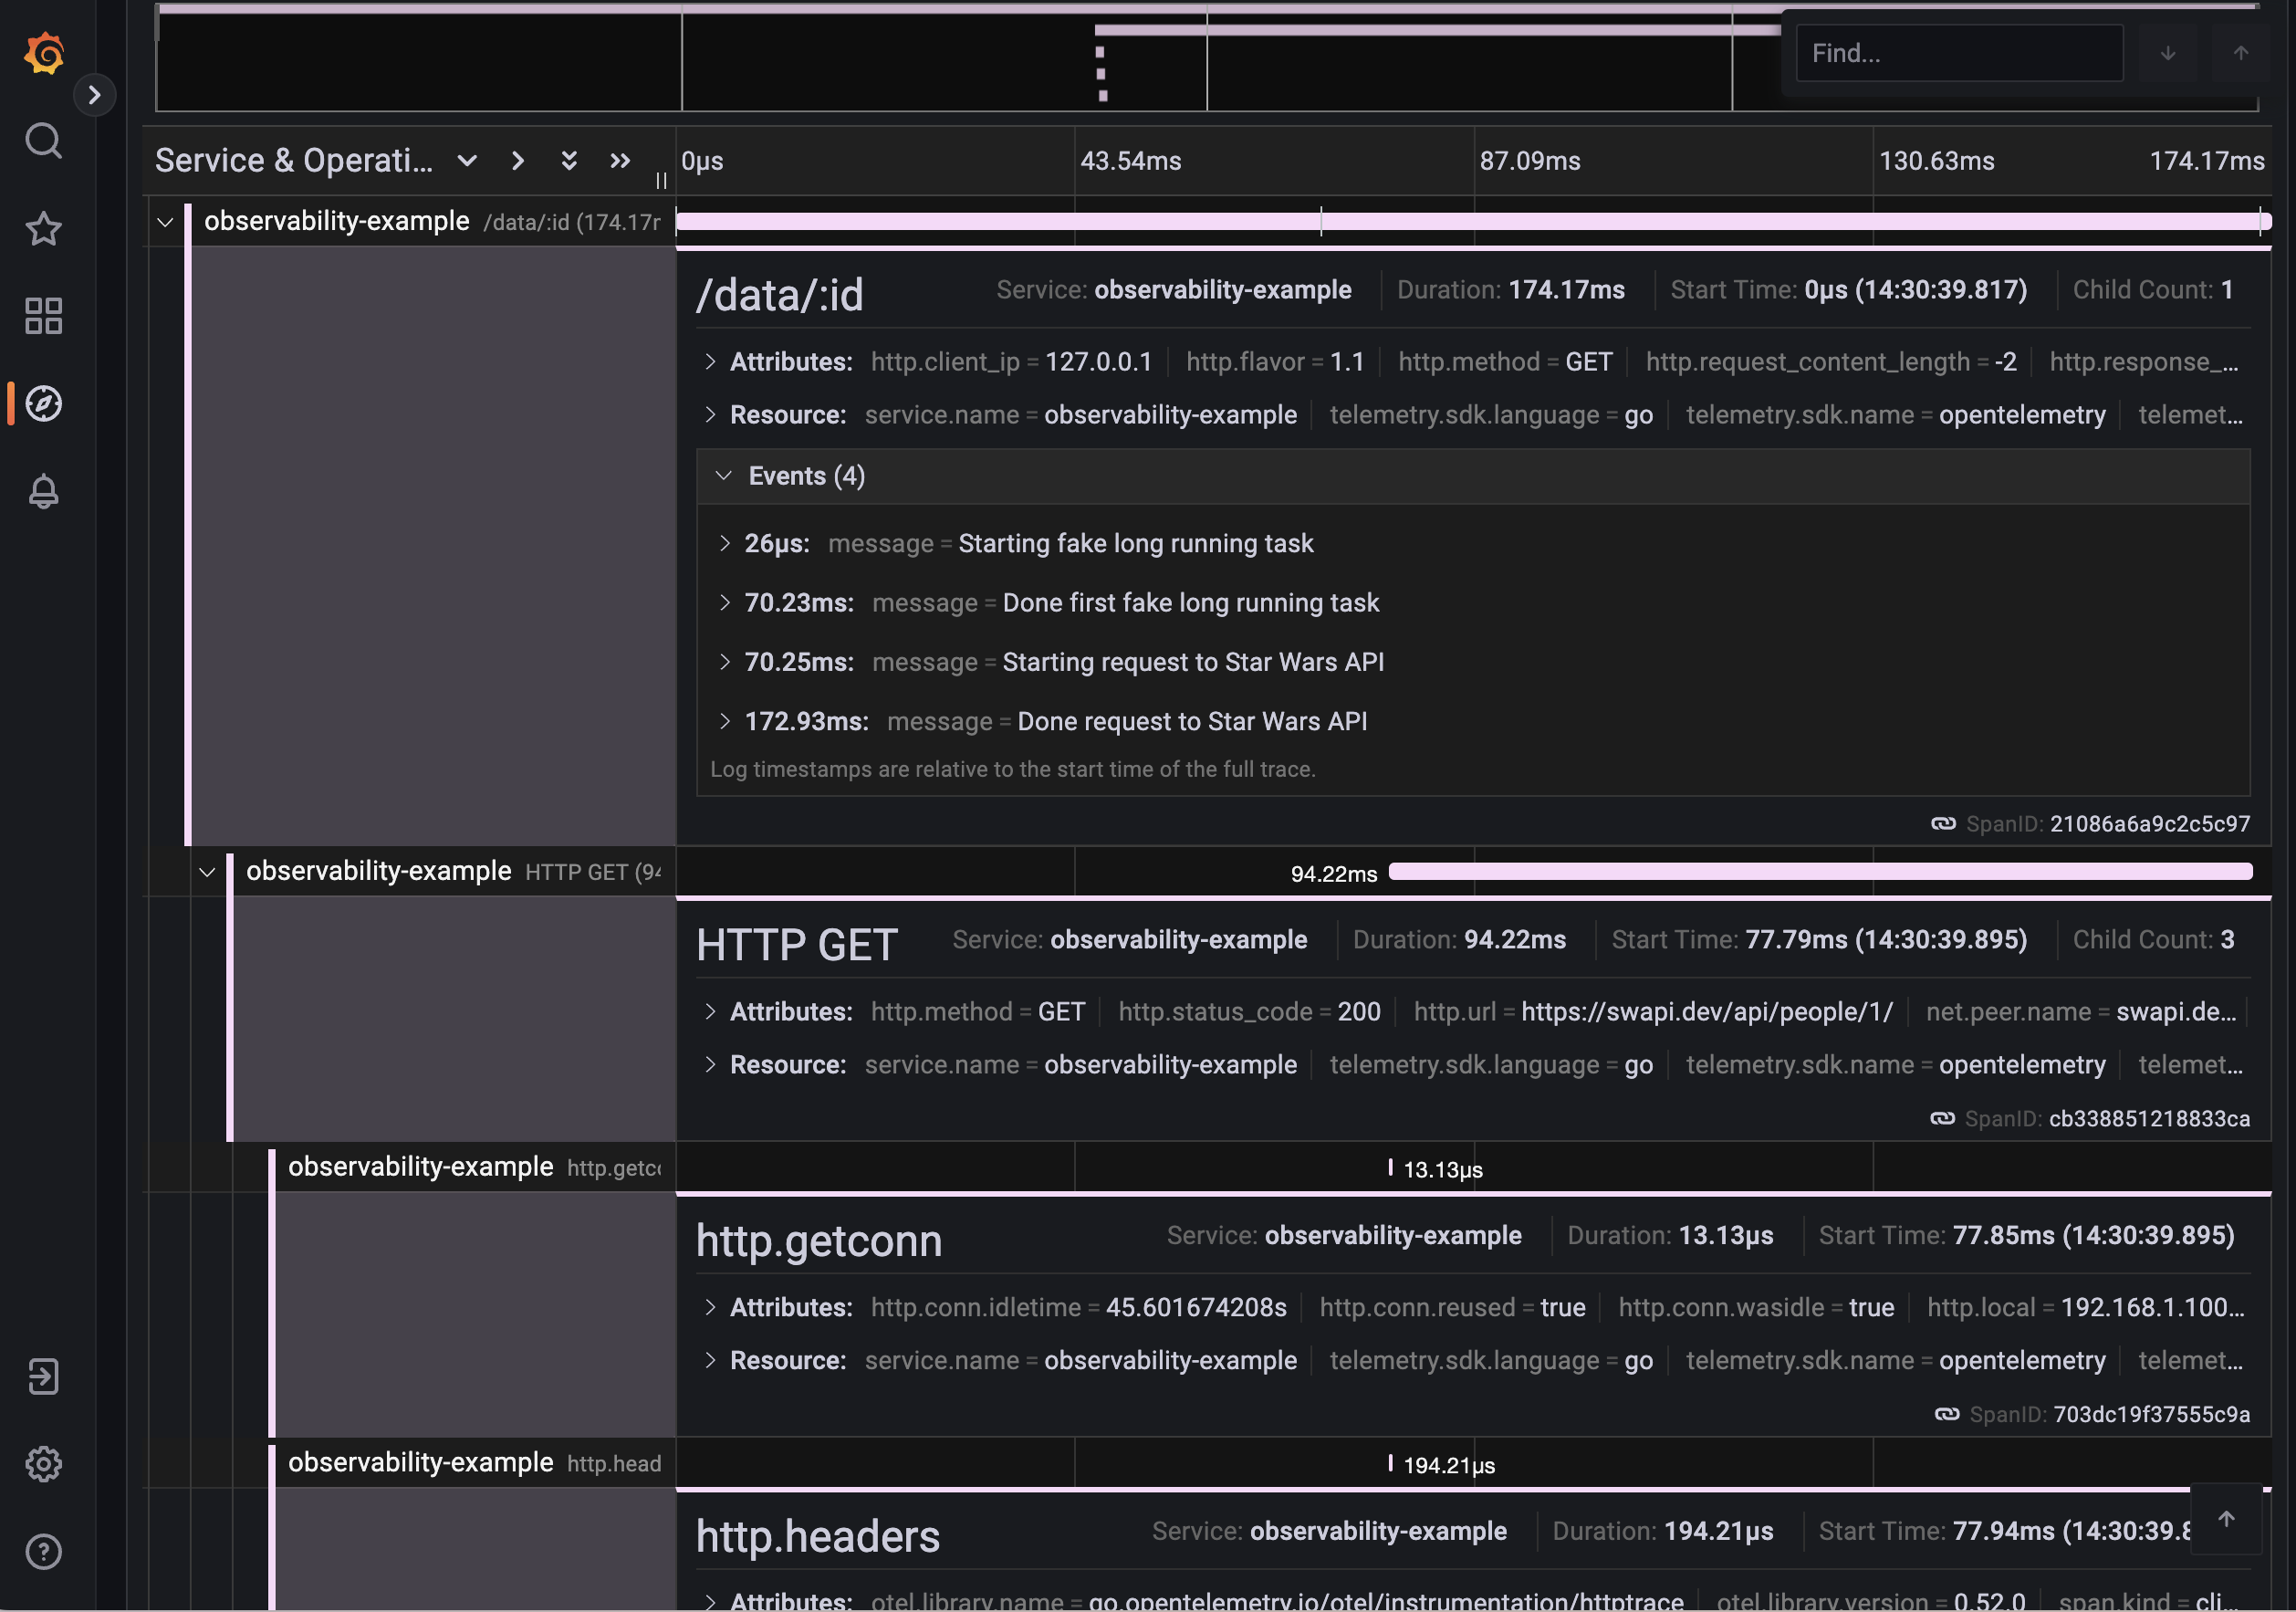
Exploring the traces on Grafana via Tempo datasource;
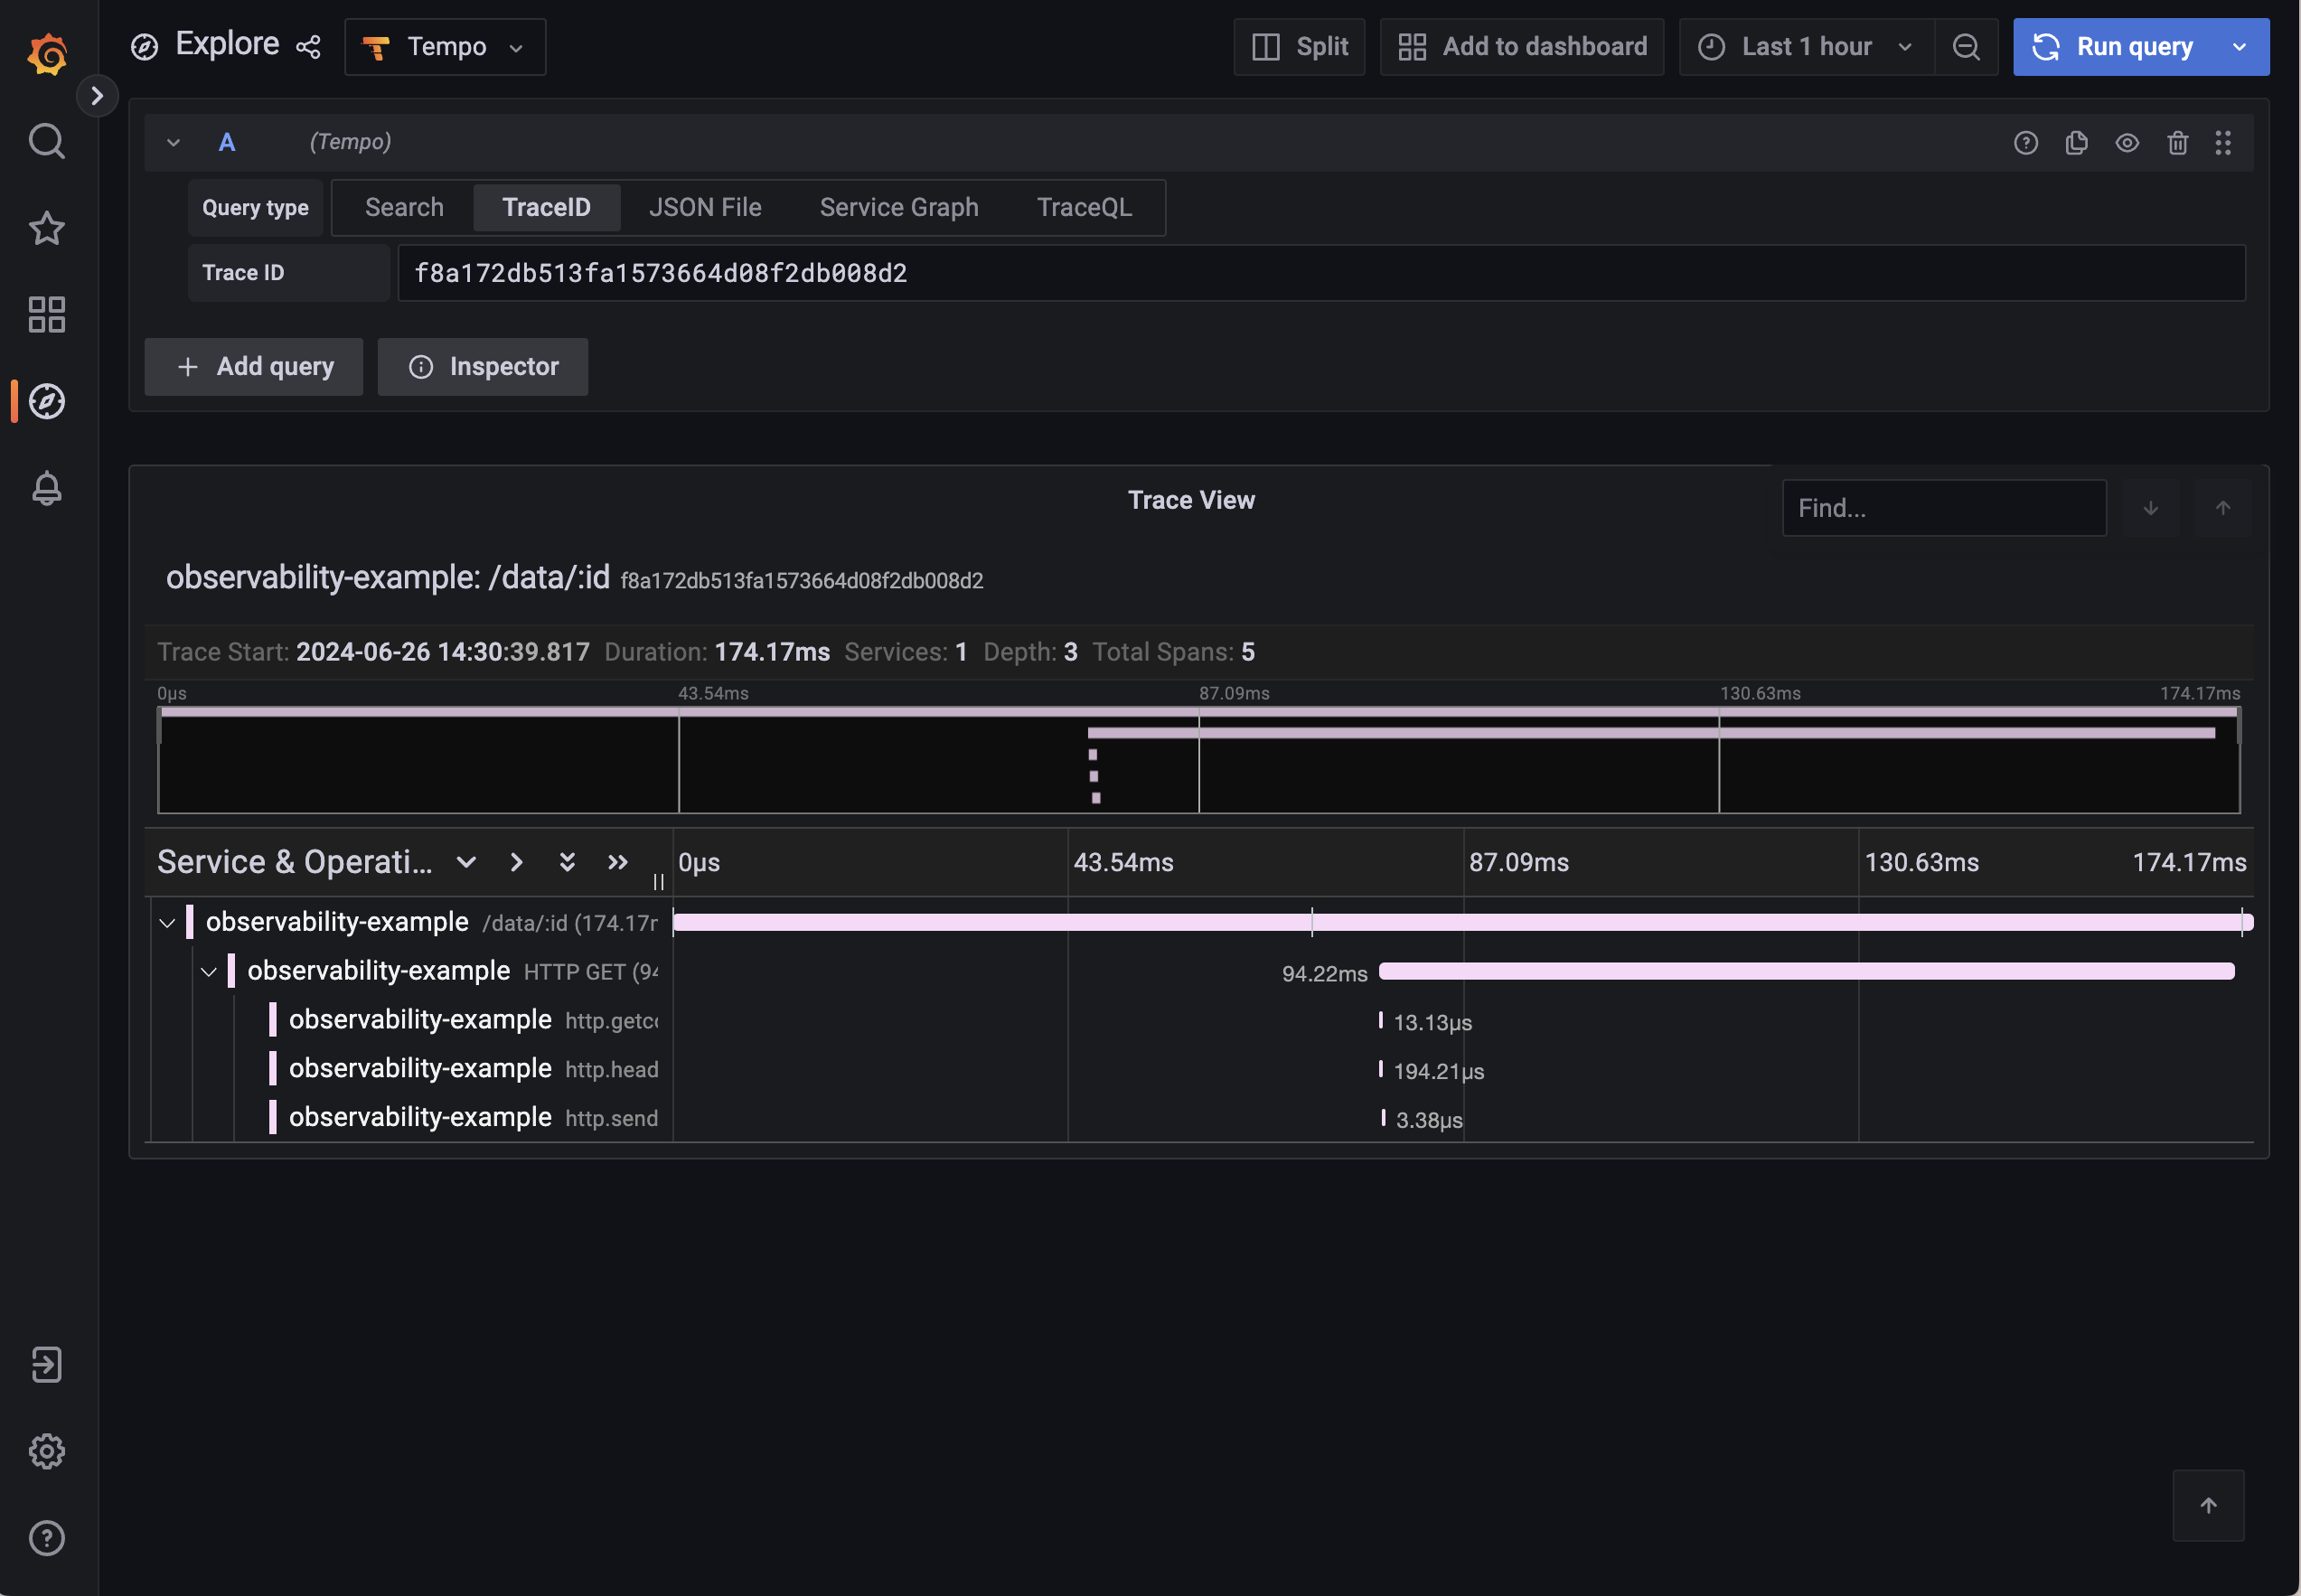
Also you can see the much more detail on tempo dashboard;
Source Code and How to run the Application
You can find the source code in here.
To run the application dependencies like prometheus, loki, grafana, tempo and kafka, you can use the docker-compose file inside the container folder. But I have already covered the command in Makefile, so you can call the following command only;
Running depended services:
1make local-up
1- Set the /etc/hosts file for the kafka1, kafka2 and kafka3 hostnames as 127.0.0.1 local ip.
2- .vscode folder contains the initial setup to debug golang application on your local machine. Just be sure that you have installed the delve debugger.
2.1- Other option; you can build the binary and run directly.(You have to set .env environment variables as well.)
1make build